A goal in Optimizer represents a specific loyalty objective you want to achieve, for example, improving member engagement or increasing redemption activity. Each goal has an associated dashboard where all related charts and analyses are organized.
Dashboards serve as the central hub for exploring your loyalty data, turning raw information into measurable outcomes and providing a basis for further analysis and insights.
Creating a Goal
Navigate to the Goals menu in the sidebar of the Manage Goals option on the Homepage.
Here you will see all the goals you’ve already created (if any).Click + New goal in the top-right corner.
Choose between:
Suggested Goal
Custom Goal
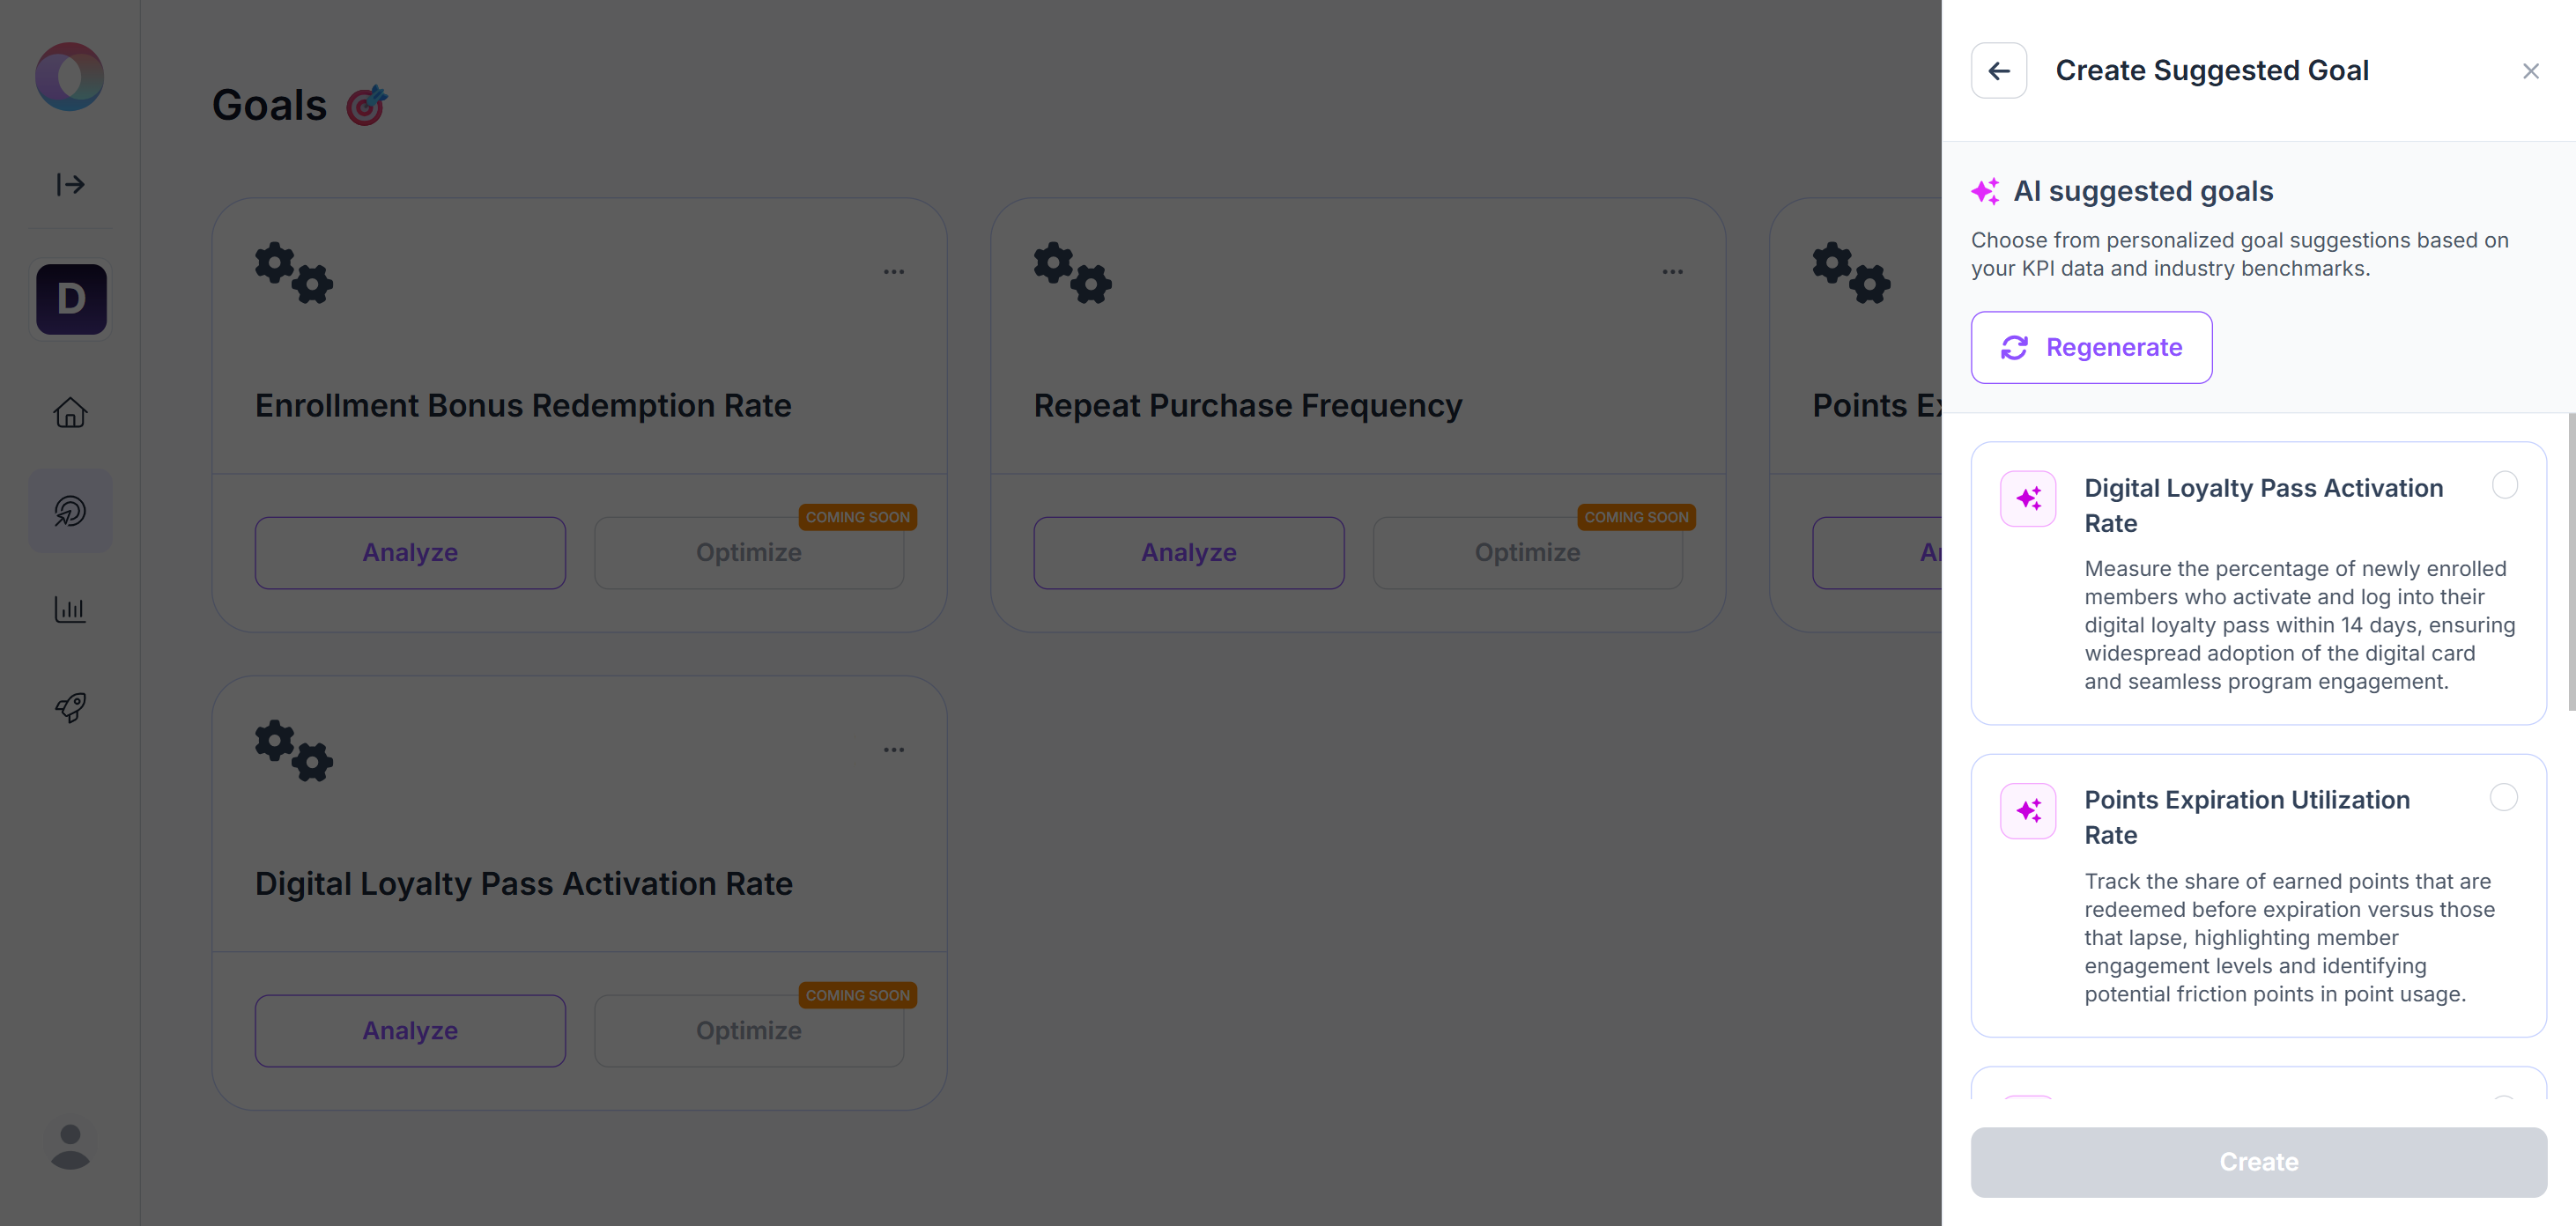
Suggested Goal
Use this option if you want AI-recommended goals tailored to your loyalty program. Suggested goals are AI-assisted recommendations generated from your loyalty dataset and the preferences you set in the onboarding questionnaire. They provide a quick way to start with objectives that are relevant to your specific program.
Select one of the suggested goals.
If none fit, click Regenerate to see new recommendations.
Choose your goal and click Create.
The goal will now appear in your list of active goals.
Start with Suggested Goals to quickly populate your dashboard and learn how Optimizer structures performance tracking. Switch to Custom Goals once you have specific targets or unique success criteria in mind.
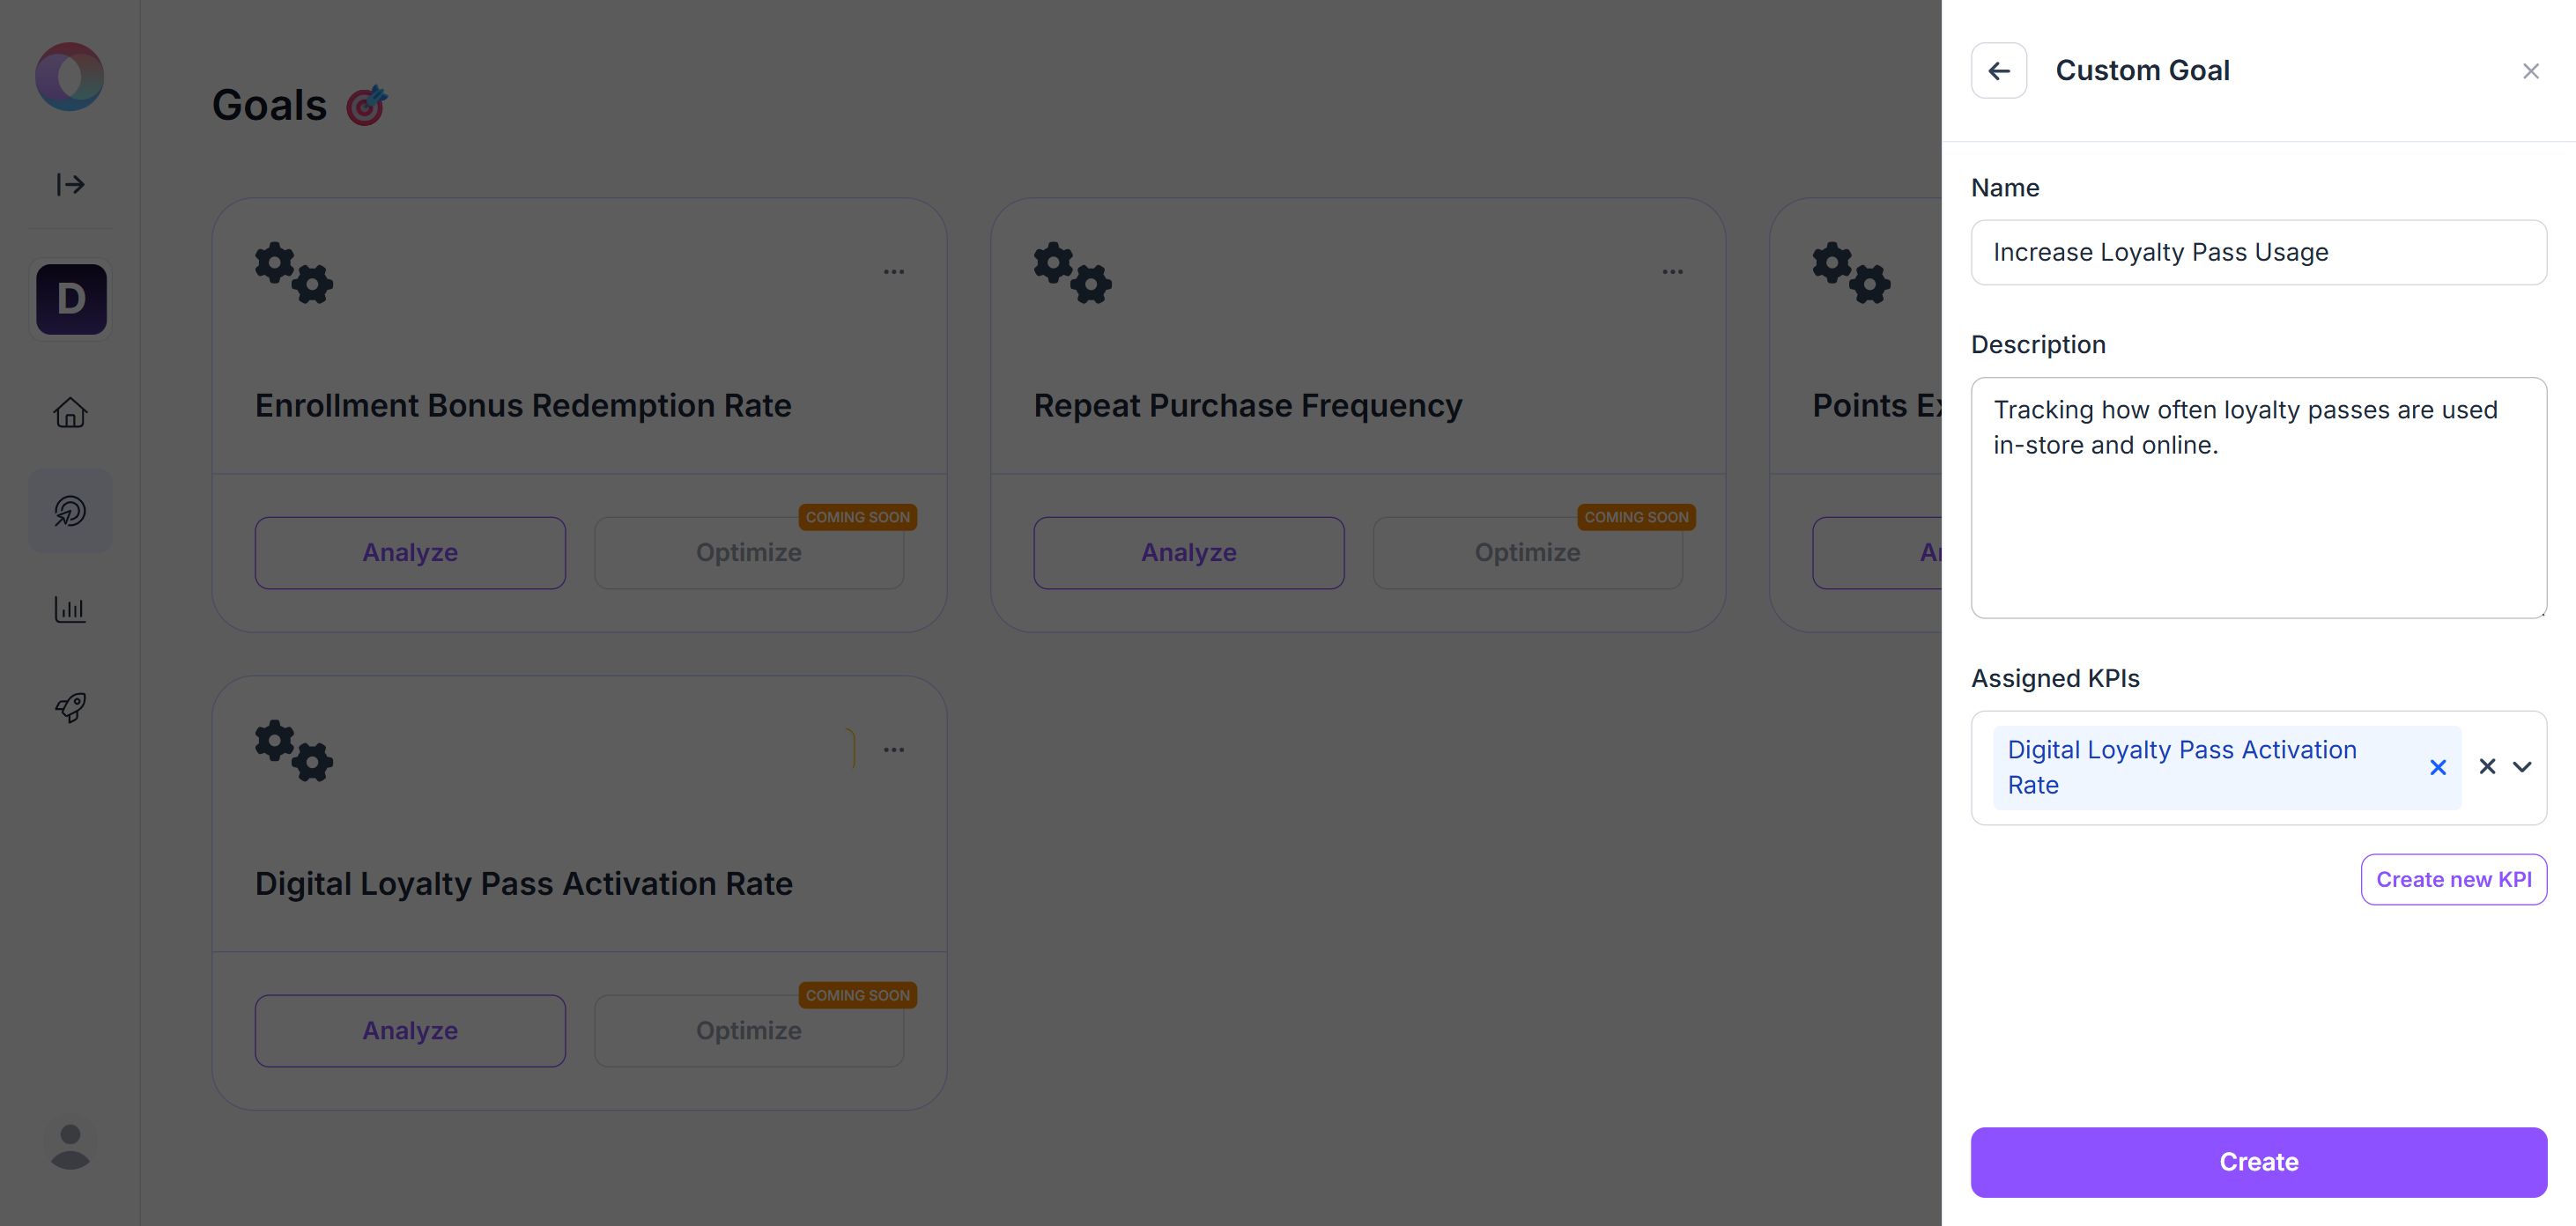
Custom Goal
Use this option when you want to define your own loyalty objective. It can be as specific or as broad as you need (e.g., “Increase referral-based sign-ups by 15%” or “Increase Customer Lifetime Value”).
Define the name and description of the goal.
Assign one or more KPIs to measure its success (this can also be done later).
Save the goal, and it will appear in your list of goals.
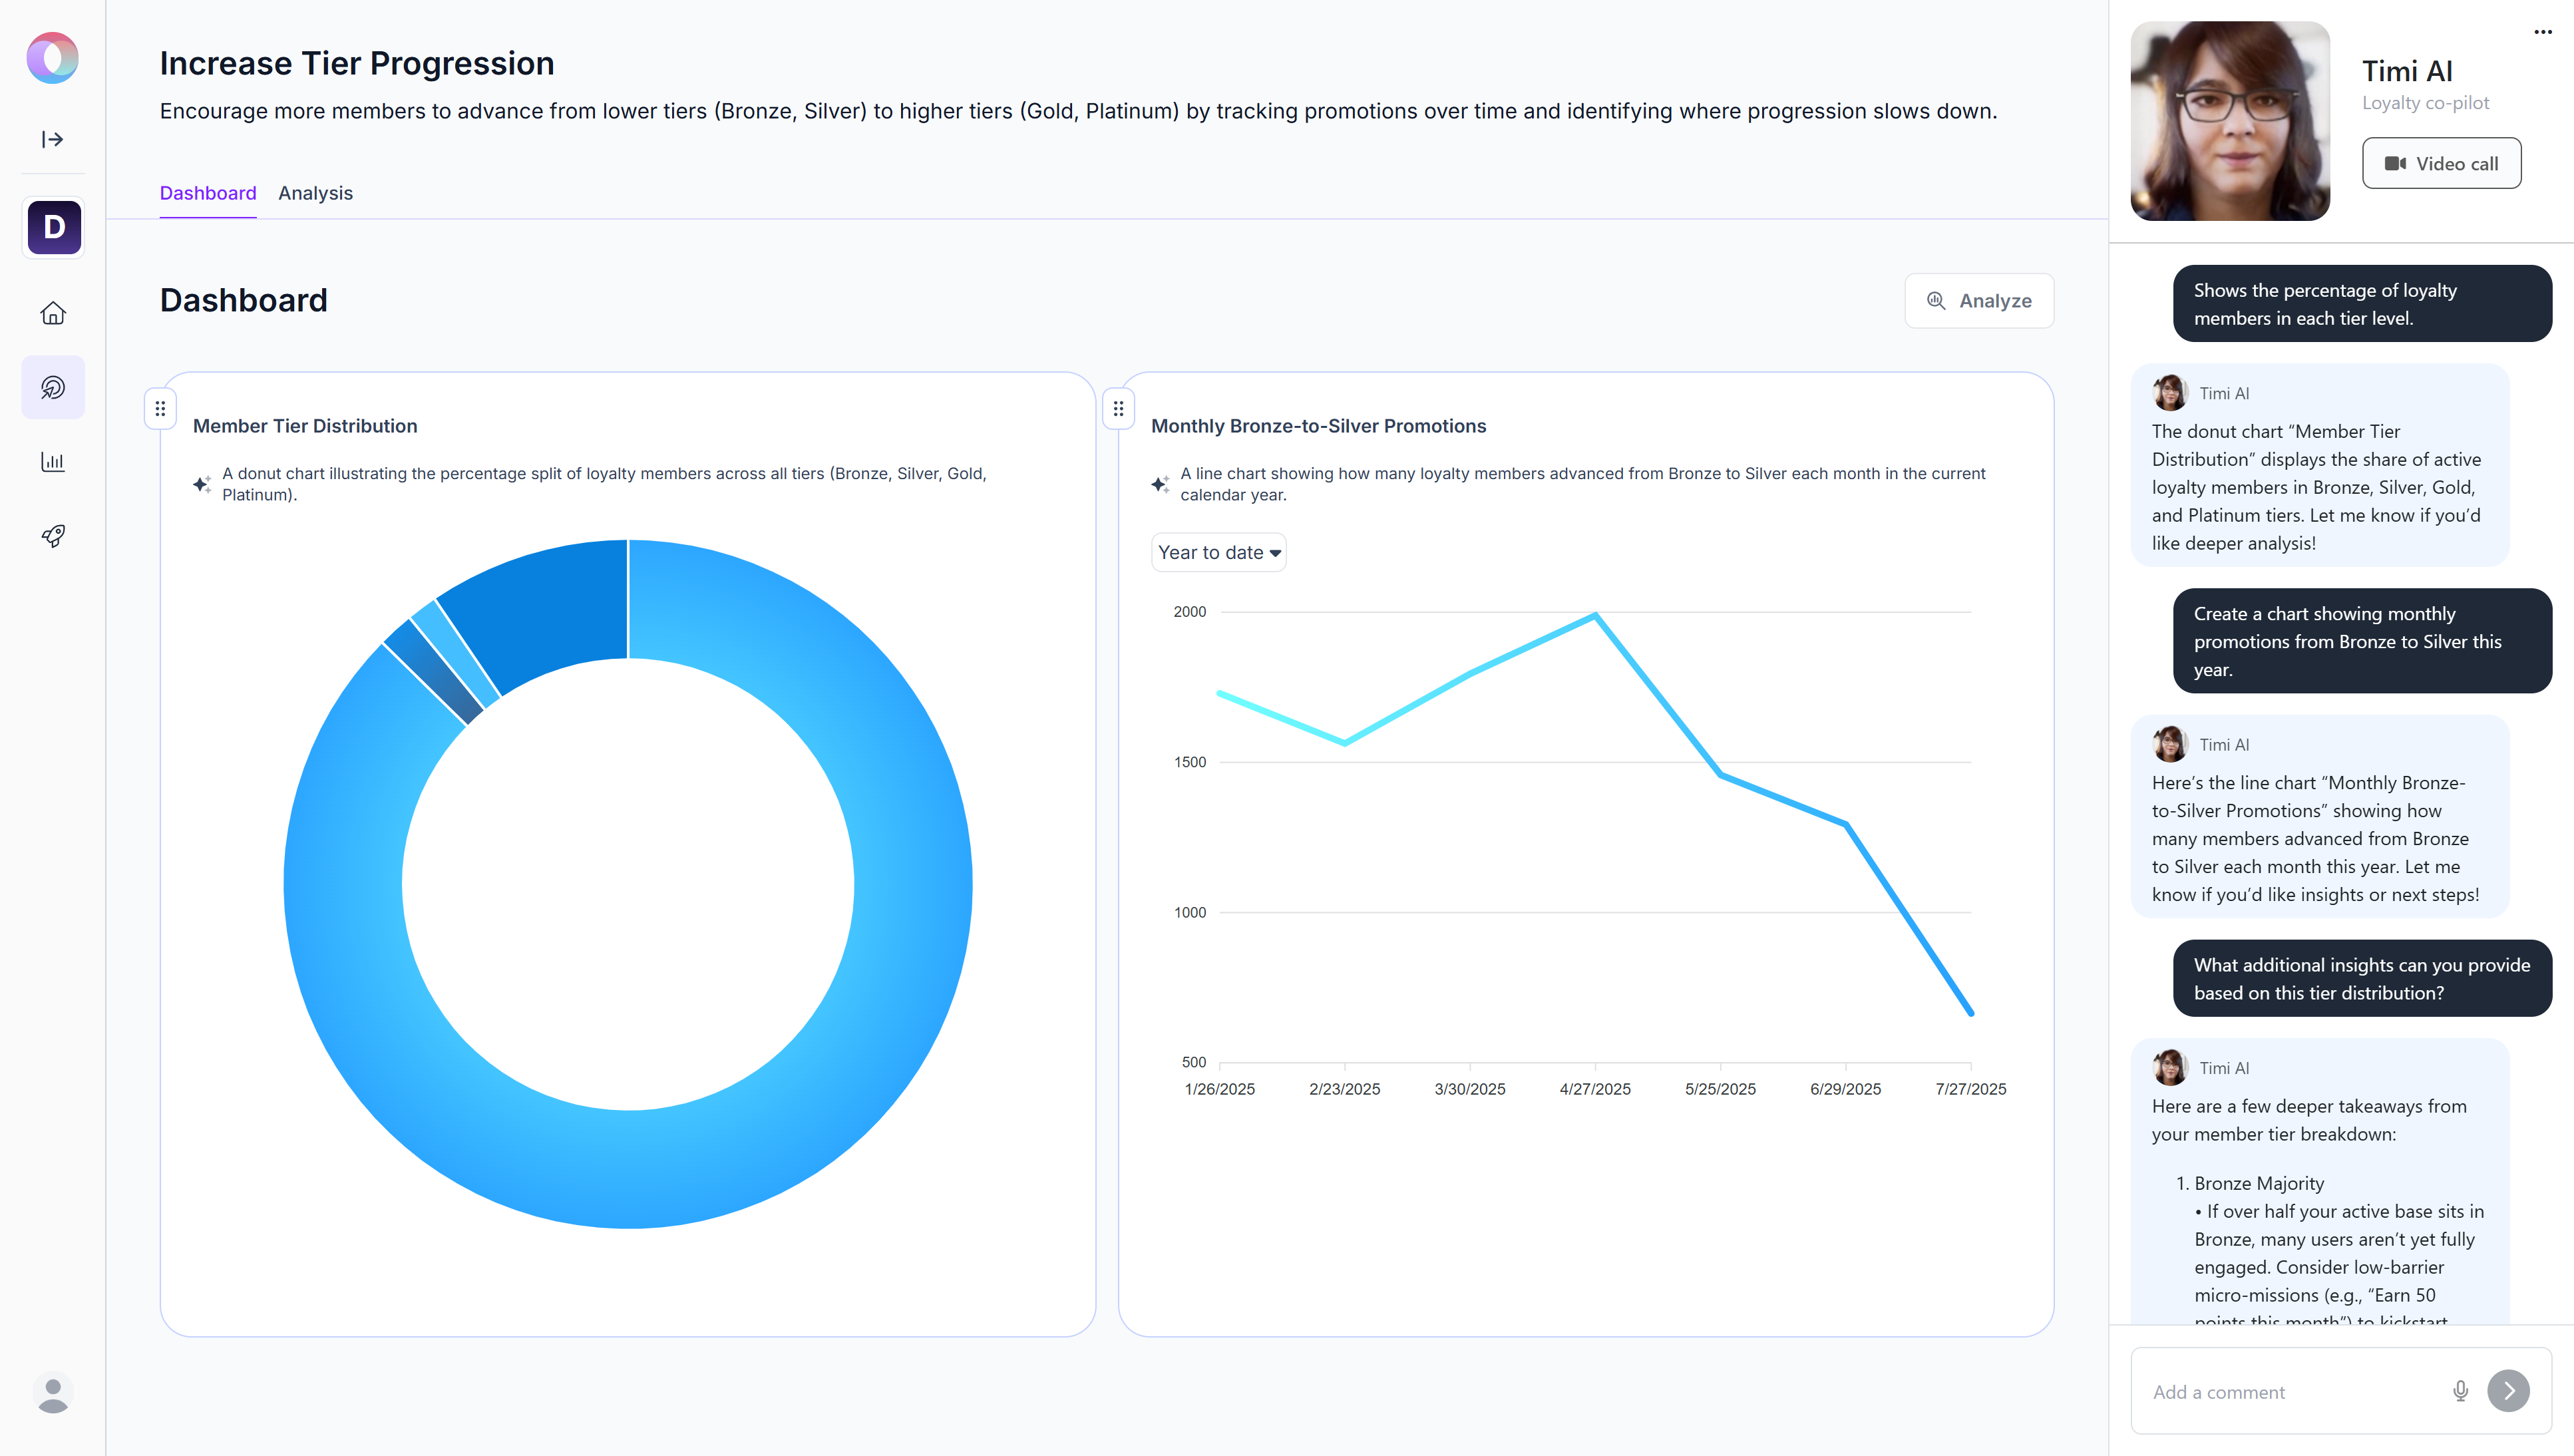
Working with Timi AI
On each Goal card, click the Analyze button to open the Goal Dashboard. The dashboard is where all charts for that goal live, and it includes Timi AI, your copilot for exploring and visualizing loyalty data. In the conversation window, you can type questions or requests in natural language. Timi, your copilot, will respond by creating relevant charts and written insights based on your data.
How to use prompts:
Phrase your requests clearly and completely. The more specific you are, the more accurate and useful the chart will be.
Include key details, like metric, timeframe, granularity, and chart type.
Decide if you want a rolling period (always up to date) or a fixed period (e.g., ending on 22-09-2025).
The conversation keeps its context within the same goal, so you can refine your request or build on earlier queries. Whenever you update your instructions, Timi generates a new version of the chart based on the latest prompt. You can also ask interpretive questions about the results, and Timi AI will provide written explanations directly in the chat.
Switching to another goal starts a new context, without remembering what you asked before in other goals.
DON’Ts | DOs |
|---|---|
Give me a chart of purchases in the past 1 year. | Give me a line chart showing monthly purchases over the past 12 months. Make it rolling so that any day I check, it shows the latest data. |
Show me redemptions. | Create a bar chart of reward redemptions broken down by months for the past quarter, ending on 22-09-2025. |
Compare sign-ups. | Show a line chart comparing online sign-ups vs. in-store sign-ups over the past year on a monthly basis. |
You can use the Clear chat option under the … menu in the top-right corner to reset the conversation with Timi AI. This removes the current context and starts a fresh session within the same goal. It’s useful when you want to change direction completely or begin a new line of analysis without references to your previous prompts.
Chart Utilities
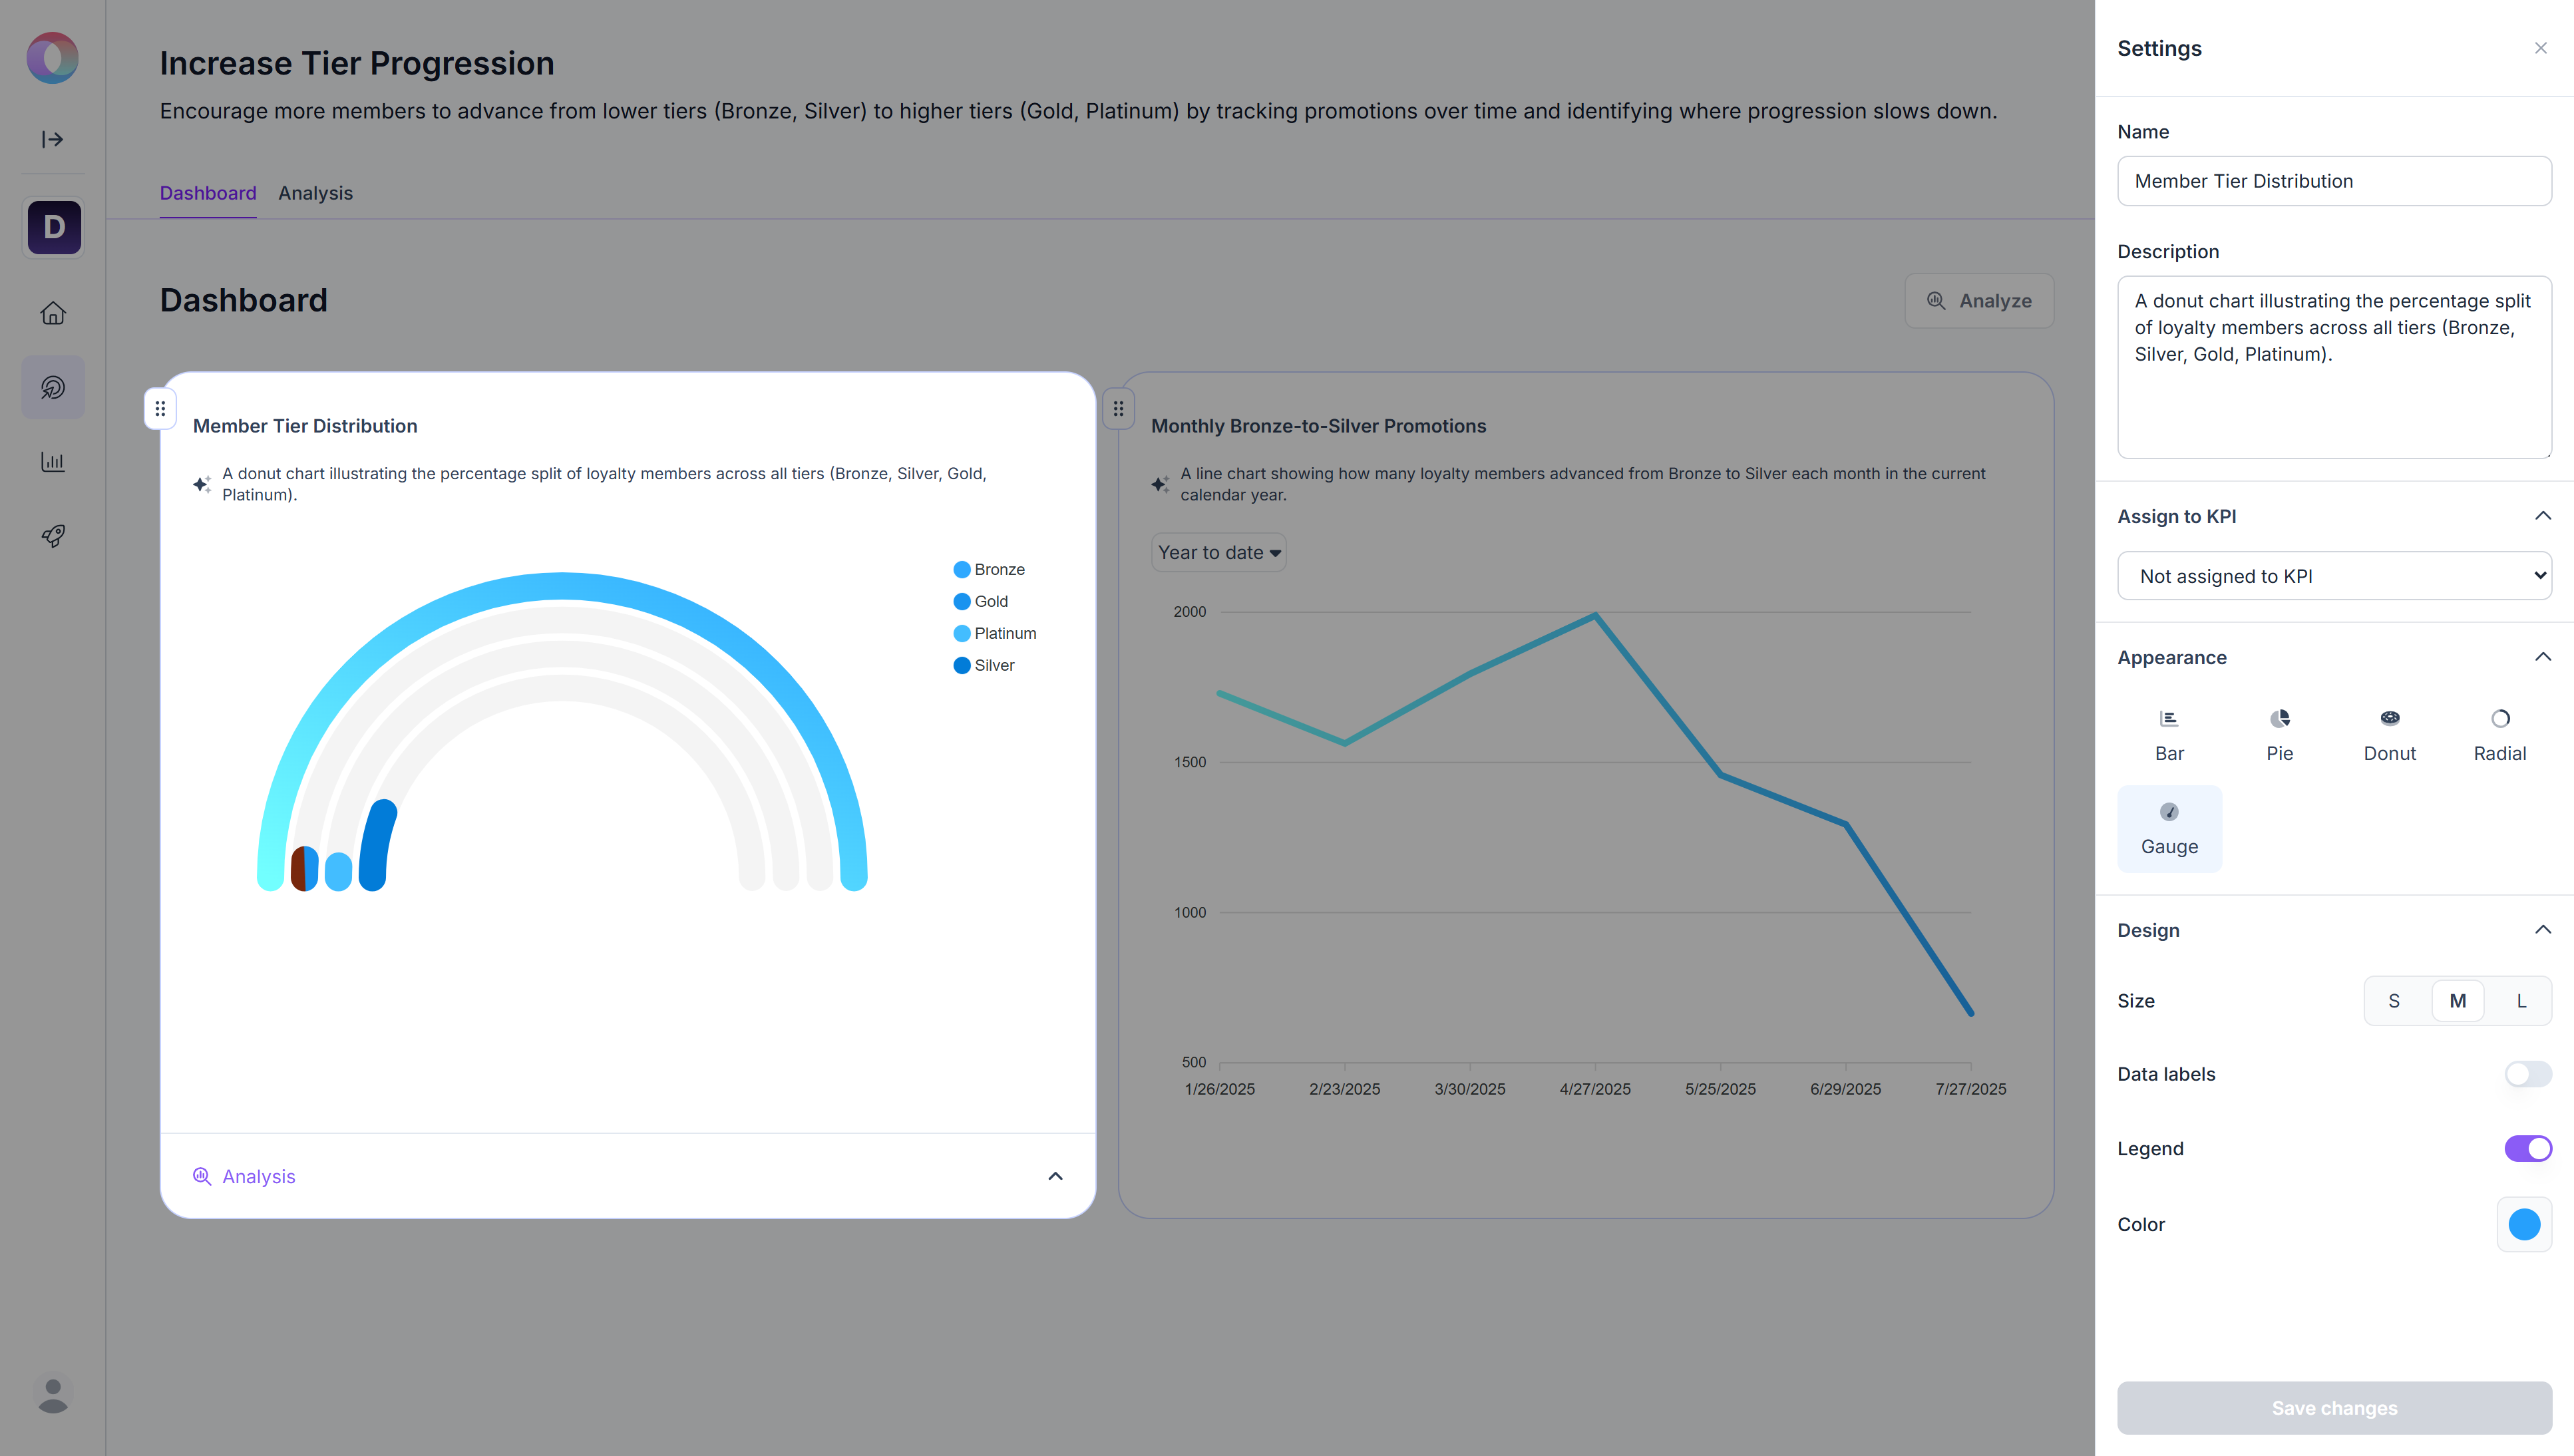
Editing Charts
Click the pencil icon to edit.
Options include:
Update name and description (default is AI-generated).
Assign the chart to a KPI.
Switch between chart types (options are provided depending on the underlying data).
Adjust design
Customize layout and styling, such as chart size, whether or not data labels appear, color preferences, and whether to display the legend (the box that explains which color or symbol represents each data group).
Click Save changes to apply the changes.
Analyzing Individual Charts
Charts are not limited to showing data points. You can request an interpretation from Optimizer to explain the chart.
Click the magnifying glass icon to request an AI interpretation.
After clicking the icon, an “Evaluate my chart” prompt is automatically sent to Timi AI in the chat window, and Timi AI immediately starts analyzing the chart data.When the analysis is complete, Timi AI posts a short summary of the results in the chat window, and the Analysis button appears on the chart card.
Clicking the Analysis button opens the detailed analysis.
Chart analysis: main findings of the data and specific insights you should note.
Context and setup: timeframe and dimensions of the chart.
Analysis & insights: trend observations and deeper commentary.
Implications and next steps: recommendations for further actions.
(2).png)
Exporting, Deteting, and Rearranging
Under the … menu in the top right corner of the chart card, you can:
Download data as CSV to export the underlying dataset.
Download the chart as an image to save it as a PNG image.
Delete the chart from the Dashboard.
You can also rearrange charts on your Dashboard using the drag handle in the top-left corner.
Analyzing a Goal
While individual chart analysis helps you understand specific data points, you can also analyze the entire dashboard of a goal. This gives you a consolidated report of all charts and provides structured findings.
Click the Analyze button on the Dashboard page.
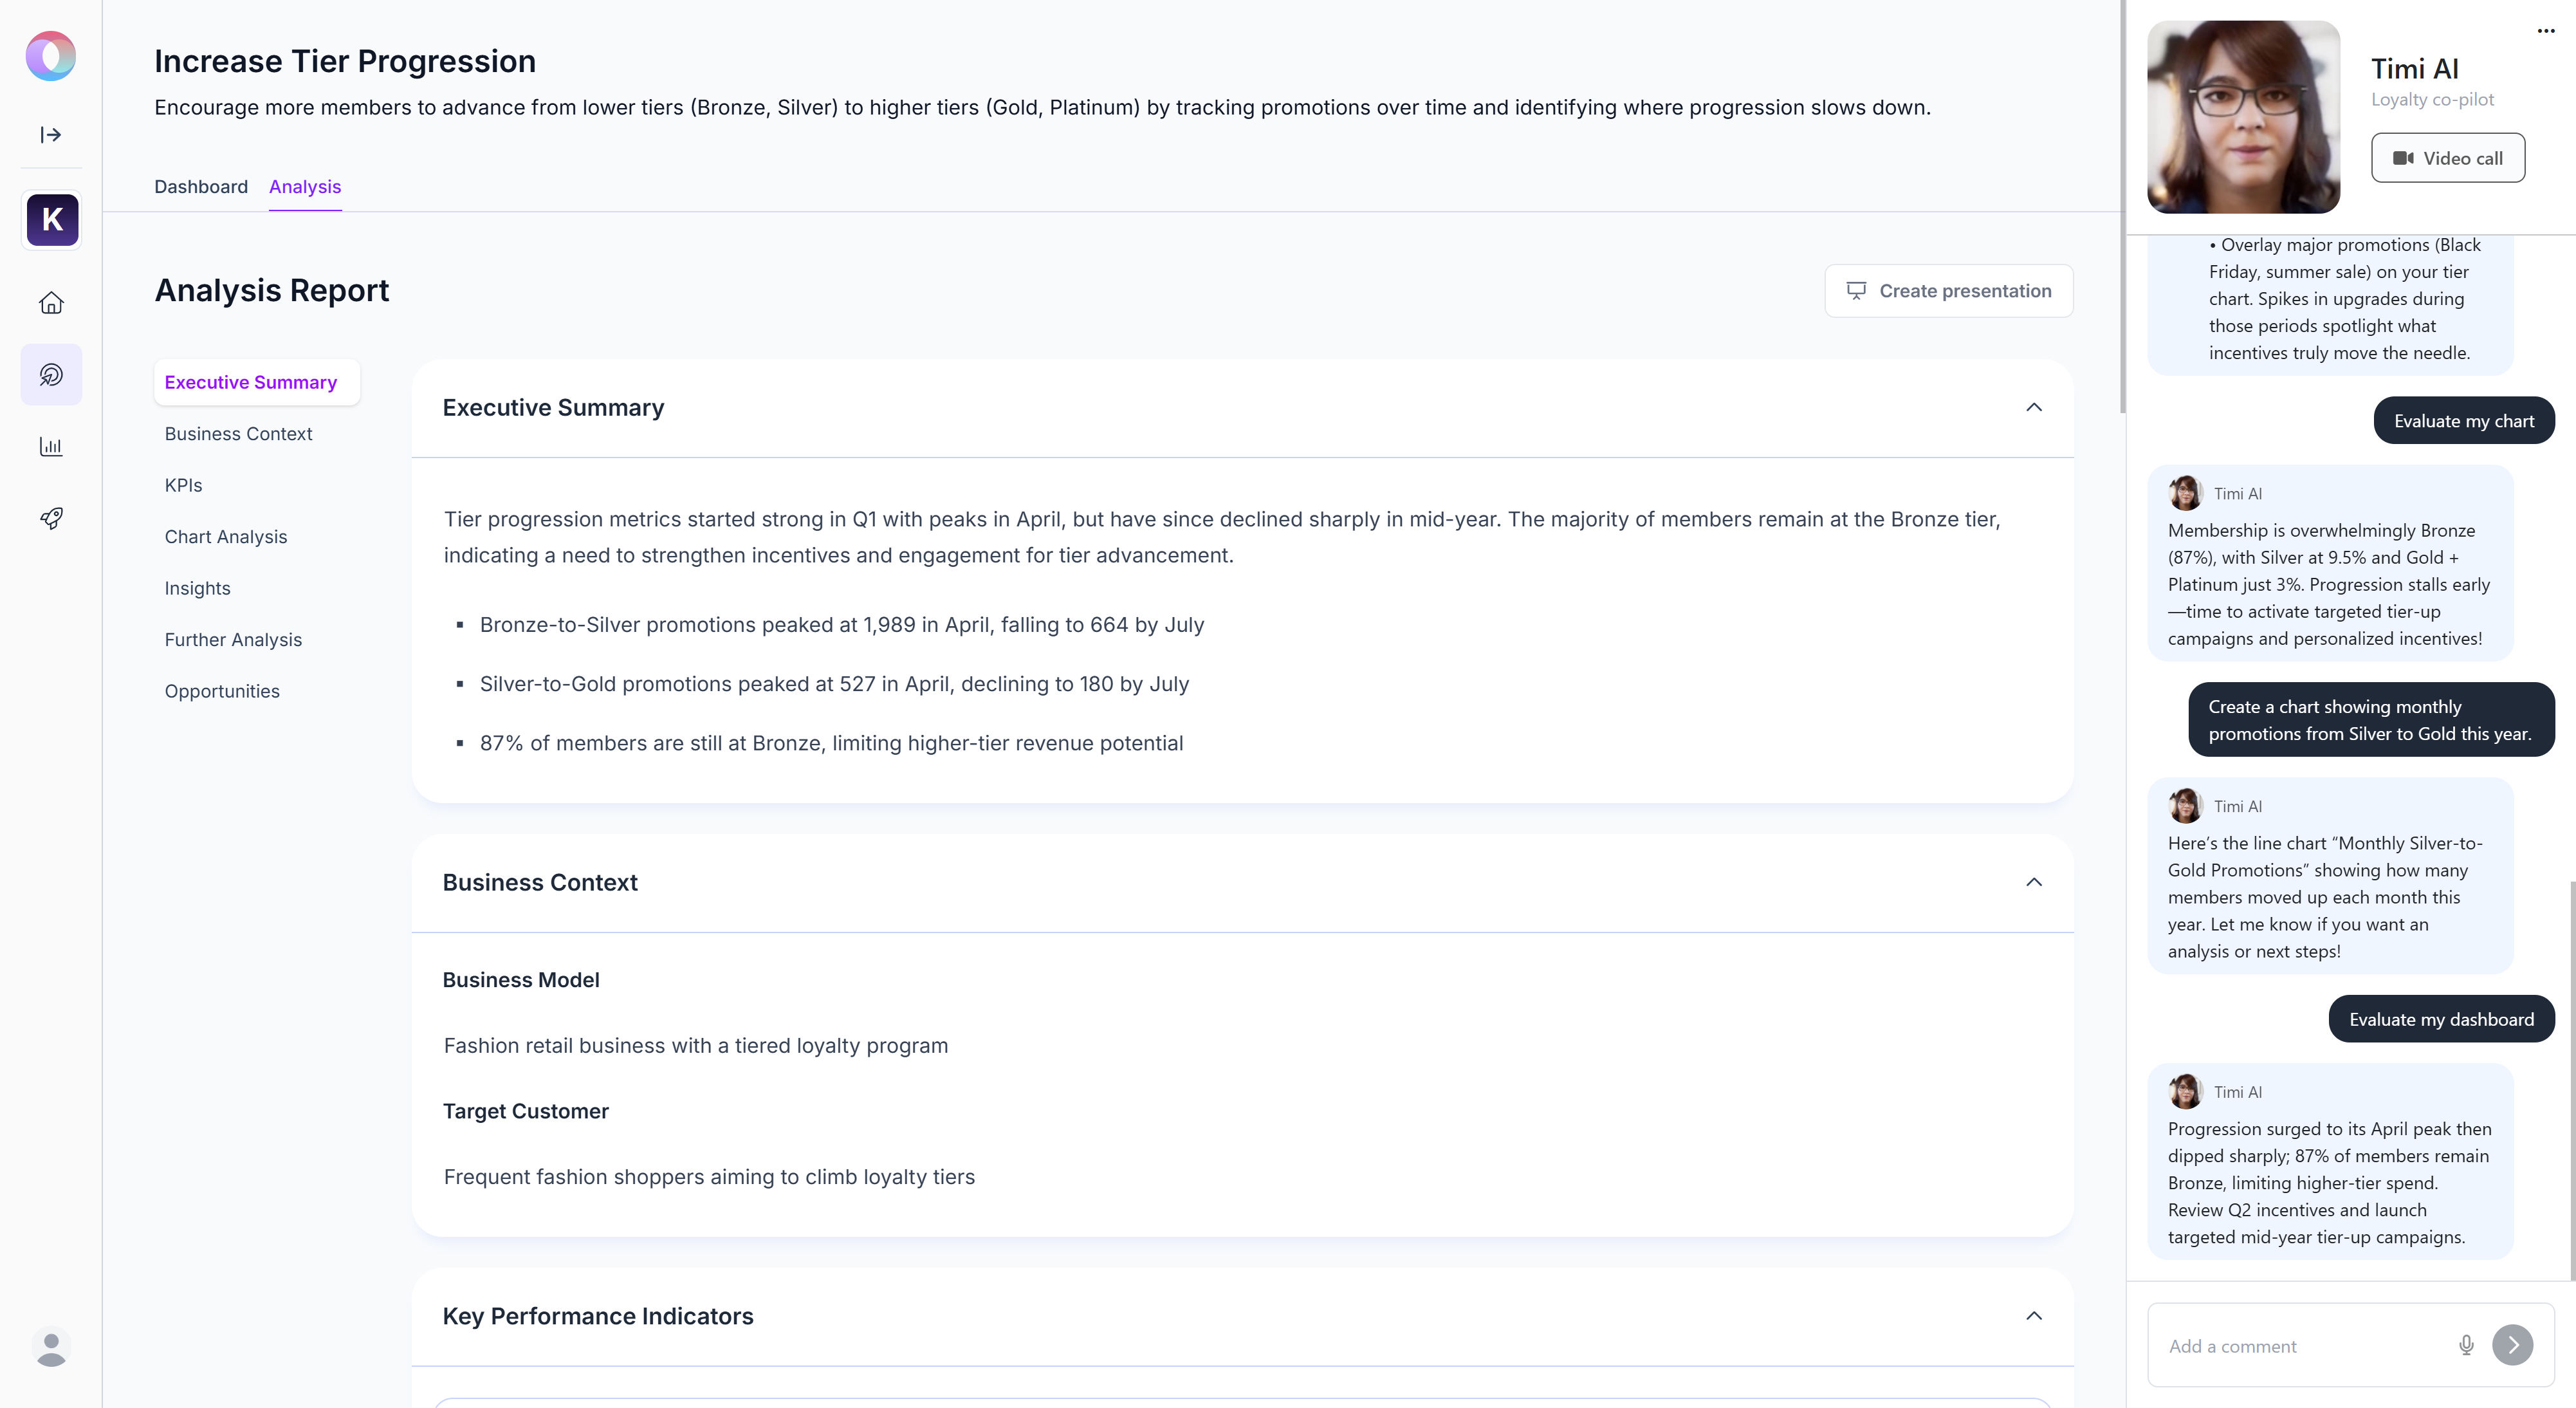
After clicking the icon, an “Evaluate my dashboard” prompt is automatically sent to Timi AI in the chat window, and Timi AI immediately starts analyzing the chart data.When the analysis is complete, Timi AI posts a short summary of the results in the chat window, and the Analysis Report is generated.
Optimizer generates a structured Goal Analysis Report, including:
Executive Summary: high-level overview of main findings across the Dashboard.
Business Context: background of the loyalty program type and target customers.
Key Performance Indicators: data presented in the individual charts.
Chart Analysis: key findings of the individual charts.
Insights: the most important conclusions of the chart analyses.
Further Analysis: suggests areas to explore deeper.
Opportunities: actionable recommendations.
When you hover over a section, two icons appear:
A magnifying glass icon to request further explanation, where the Optimizer generates an expanded analysis. You can choose to replace the original version or keep both for comparison.
A pencil icon to edit the text manually to adjust wording or add notes.
Exporting and Sharing Insights
Once a Goal analysis is ready, you can generate a presentation file for easy sharing. This saves time preparing management reports and ensures consistency between data analysis and communication. Use this feature to brief your team or management regularly.
Click Create Presentation to export the analysis as a .pptx slideshow.
Managing Goals
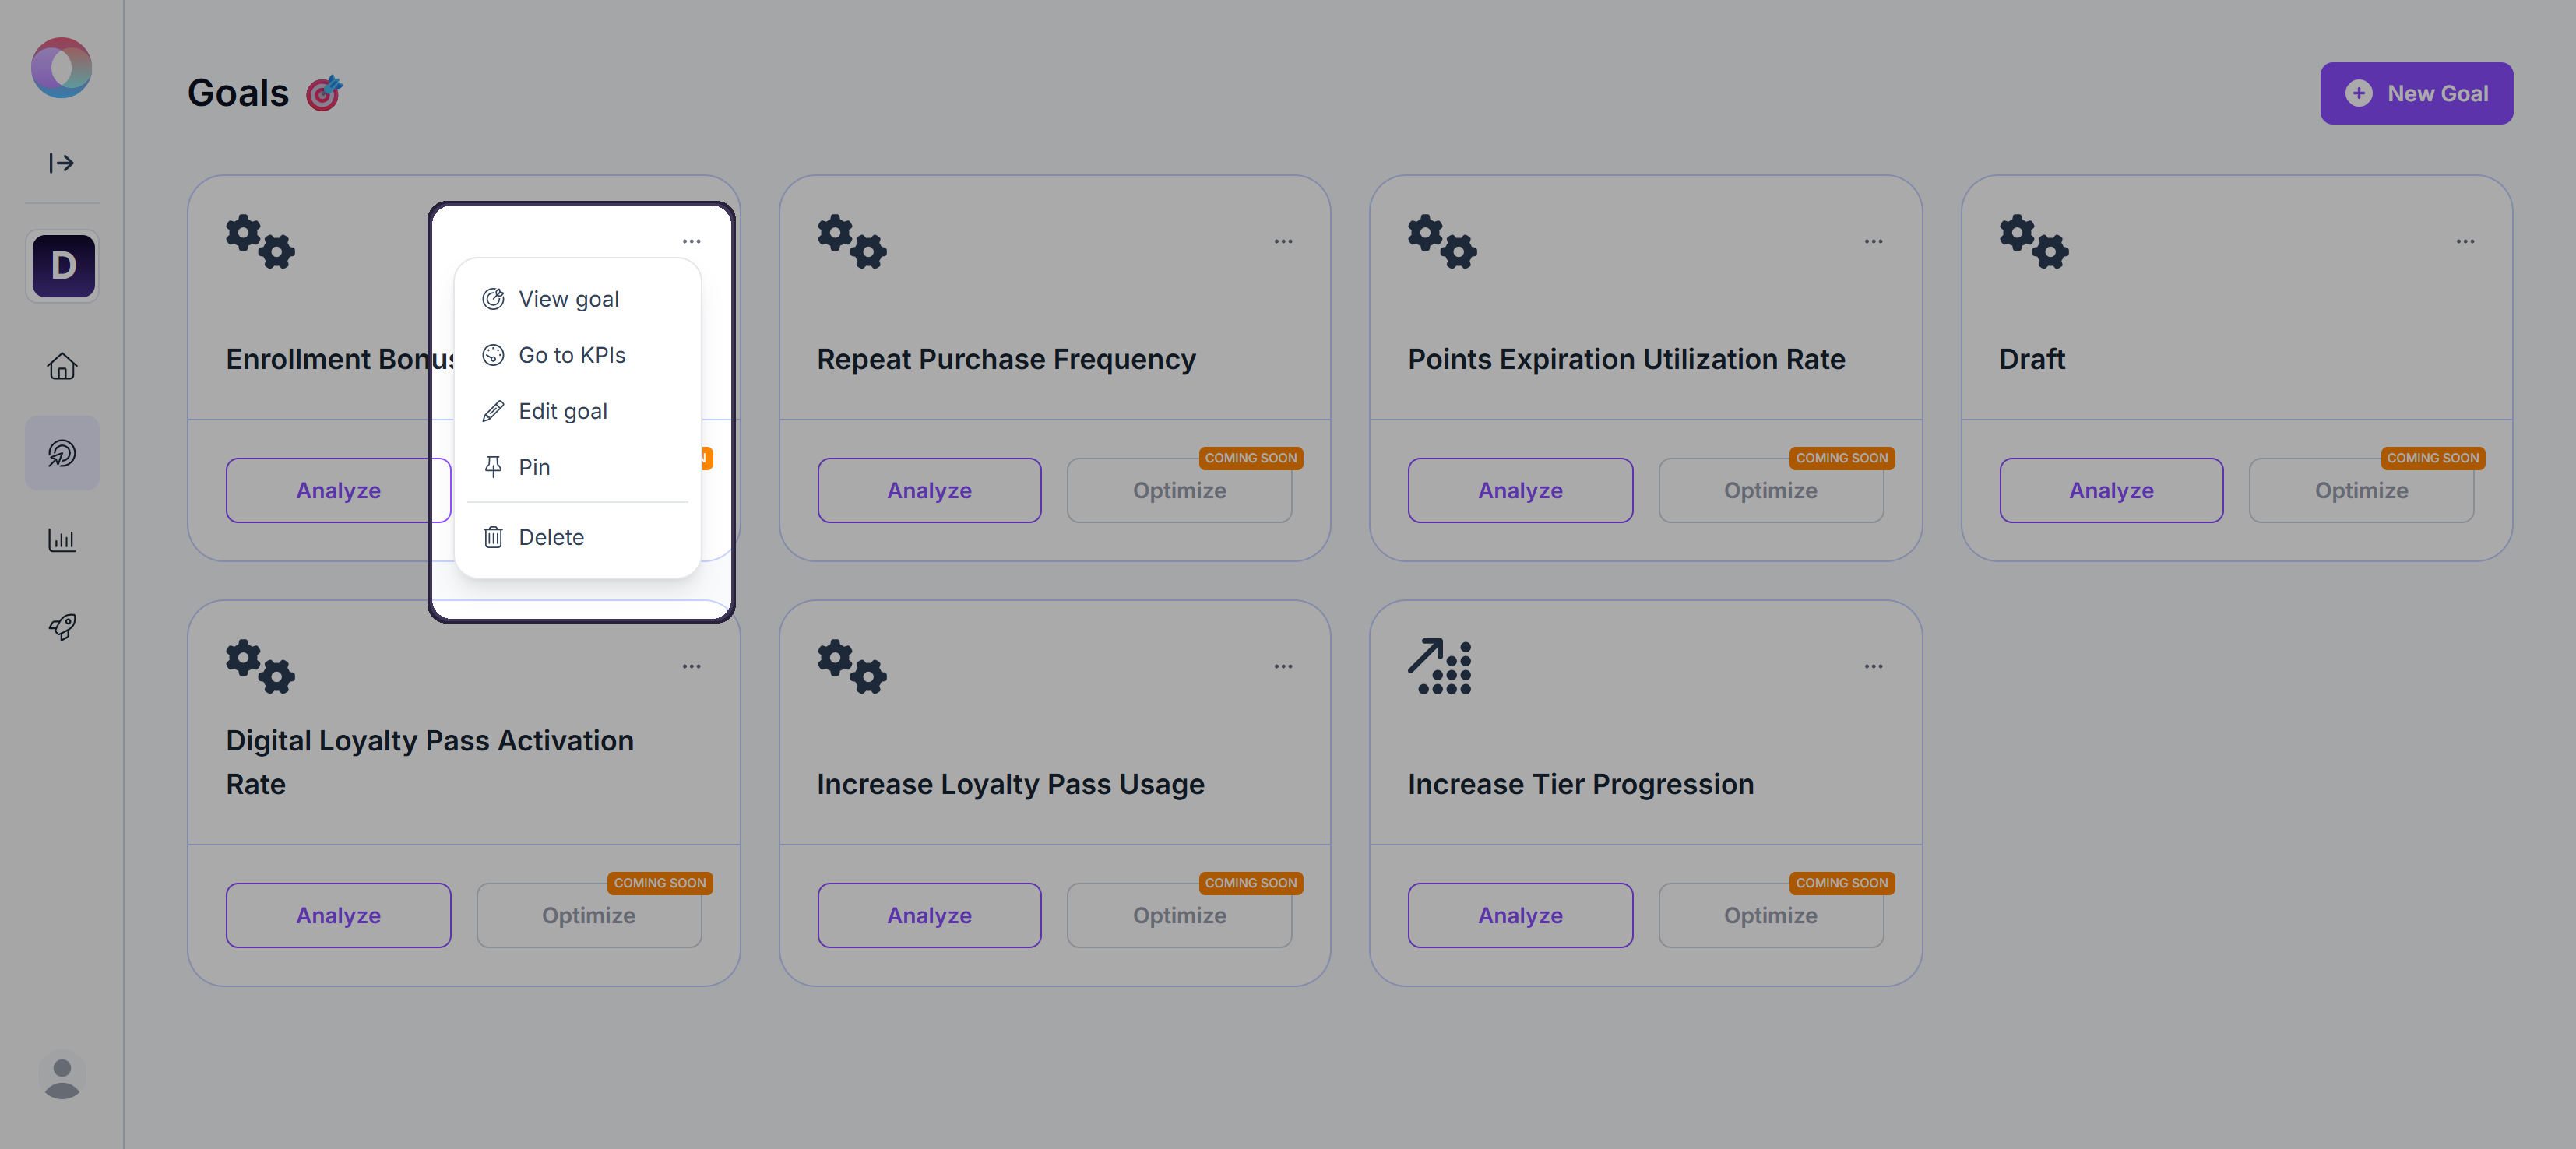
You can manage your goals from the Goals page or the Manage Goals option on the Homepage. Each goal card includes actions to help you view, edit, and organize your goals.
Options under the … menu:
Click View Goal to open the full dashboard of the goal, including Timi AI and all related charts.
Click Go to KPIs to open the KPI list, filtered to show only the KPIs linked to this goal.
Click Edit Goal to update the goal’s name, description, and assigned KPIs.
You can also create a new KPI directly from here.Click Pin / Unpin to add or remove the goal from the My Goals section on the Homepage for quick access.
Click Delete to permanently remove the goal and its dashboard.
Connected charts and analyses are also deleted, but the KPIs themselves remain (only the links are removed).
Other options on the goal card:
Click Analyze to open the goal’s dashboard with Timi AI and all associated charts, similar to the View Goal option.